

Golden Falcon Energy Logo
Crude Oil and Derivatives Markets in 2026: Rebuilding Confidence in Gulf Trading
Energy

Crude Oil and Derivatives Markets in 2026: Rebuilding Confidence in Gulf Trading

An industry analysis of the 2026 crude oil and derivatives markets, covering the Strait of Hormuz crisis, OPEC+ policy, the rise of Murban, regional risk management and the outlook for Gulf commodity trading.

August 3, 202613 min read
Executive Summary 2026 will be remembered as one of the most turbulent periods in the modern history of the crude oil market. In under six months, the Brent benchmark surged from the mid-$60s to more than $180 a barrel before retracing almost as quickly back toward pre-crisis levels. The root cause was the effective closure of the Strait of Hormuz following military conflict between the United States, Israel and Iran — an event the International Energy Agency described as the largest supply disruption in the history of the global oil market. For trading houses based in the Gulf, this was not a passing shock but a fundamental stress test of regional pricing infrastructure, risk management practice and supply chains. This analysis traces the path of the crude oil and products markets through 2026, examines the evolution of regional benchmarks and derivatives activity, and sets out the implications for commodity traders across the Gulf, including firms active in energy trading.

1. From Crisis to Relative Calm: A Price Timeline

1.1 Rising Tension The market entered 2026 expecting a supply surplus. Early U.S. Energy Information Administration forecasts put first-quarter Brent near $55 a barrel, driven largely by non-OPEC+ production growth from the United States, Brazil, Guyana and ...

1. From Crisis to Relative Calm: A Price Timeline
1.1 Rising Tension The market entered 2026 expecting a supply surplus. Early U.S. Energy Information Administration forecasts put first-quarter Brent near $55 a barrel, driven largely by non-OPEC+ production growth from the United States, Brazil, Guyana and Canada. However, severe North American winter weather and falling exports from Kazakhstan, Russia and Venezuela cut global supply by 1.2 million barrels a day in January, setting the stage for what followed. 1.2 Crisis Peak With the outbreak of military conflict on February 28 and the effective closure of the Strait of Hormuz, the market entered full shock. The strait, which carried around 20 million barrels a day of crude and products before the crisis — along with a substantial share of the world's liquefied natural gas — was reduced to a trickle of traffic. Physical regional benchmarks reacted more violently than paper benchmarks: while Brent and WTI oscillated between roughly $90 and $120, physical Dubai crude broke through $150 a barrel, with some reports of spot trades above $166. Mid-crisis, Goldman Sachs revised its full-year Brent forecast up from $77 to $85 a barrel and projected a second-quarter average near $110, based on an assumption that strait flows would run at just 5% of normal levels for six weeks. Middle East crude production losses were running above 10 million barrels a day at the height of the disruption, with some estimates placing peak losses as high as 17 million barrels a day. 1.3 The Road Out of Crisis The signing of a memorandum of understanding between the United States and Iran on June 18 marked the market's psychological turning point. In exchange for lifting the U.S. blockade of Iranian ports, the agreement set in motion the gradual reopening of the Strait of Hormuz. Prices fell sharply: Brent, which had averaged around $107 in May, dropped to an $85 average in June — a $22 decline in a single month. Even so, the return of shipping traffic was gradual. More than 500 vessels were reported queued to exit the Gulf, and clearing naval mines from the main shipping lanes took weeks. 1.4 Normalization By early July, Brent had fallen below $70 a barrel — close to levels seen before the crisis began. Tanker traffic through the strait climbed from a May low of 9.6 million barrels a day to around 12 million barrels a day by early June, and the recovery continued from there. In its July report, the EIA said it expected most crude oil production and trade patterns to return to near pre-conflict levels by year-end, though it estimated roughly 1.4 million barrels a day of shut-in capacity would remain offline through the fourth quarter of 2026. The lesson for regional traders is clear: in markets exposed to high geographic concentration of geopolitical risk, the gap between paper benchmarks and physical prices can widen dramatically, and managing that basis gap becomes an independent source of both risk and opportunity.

2. The Strait of Hormuz: From Chokepoint to Pricing Watershed

2.1 A Vulnerability Turned Reality The Strait of Hormuz has long been recognized as the world's most sensitive energy chokepoint, but the 2026 crisis turned a vulnerability that had previously existed mainly in analysts' hypothetical models into hard reality...
2. The Strait of Hormuz: From Chokepoint to Pricing Watershed
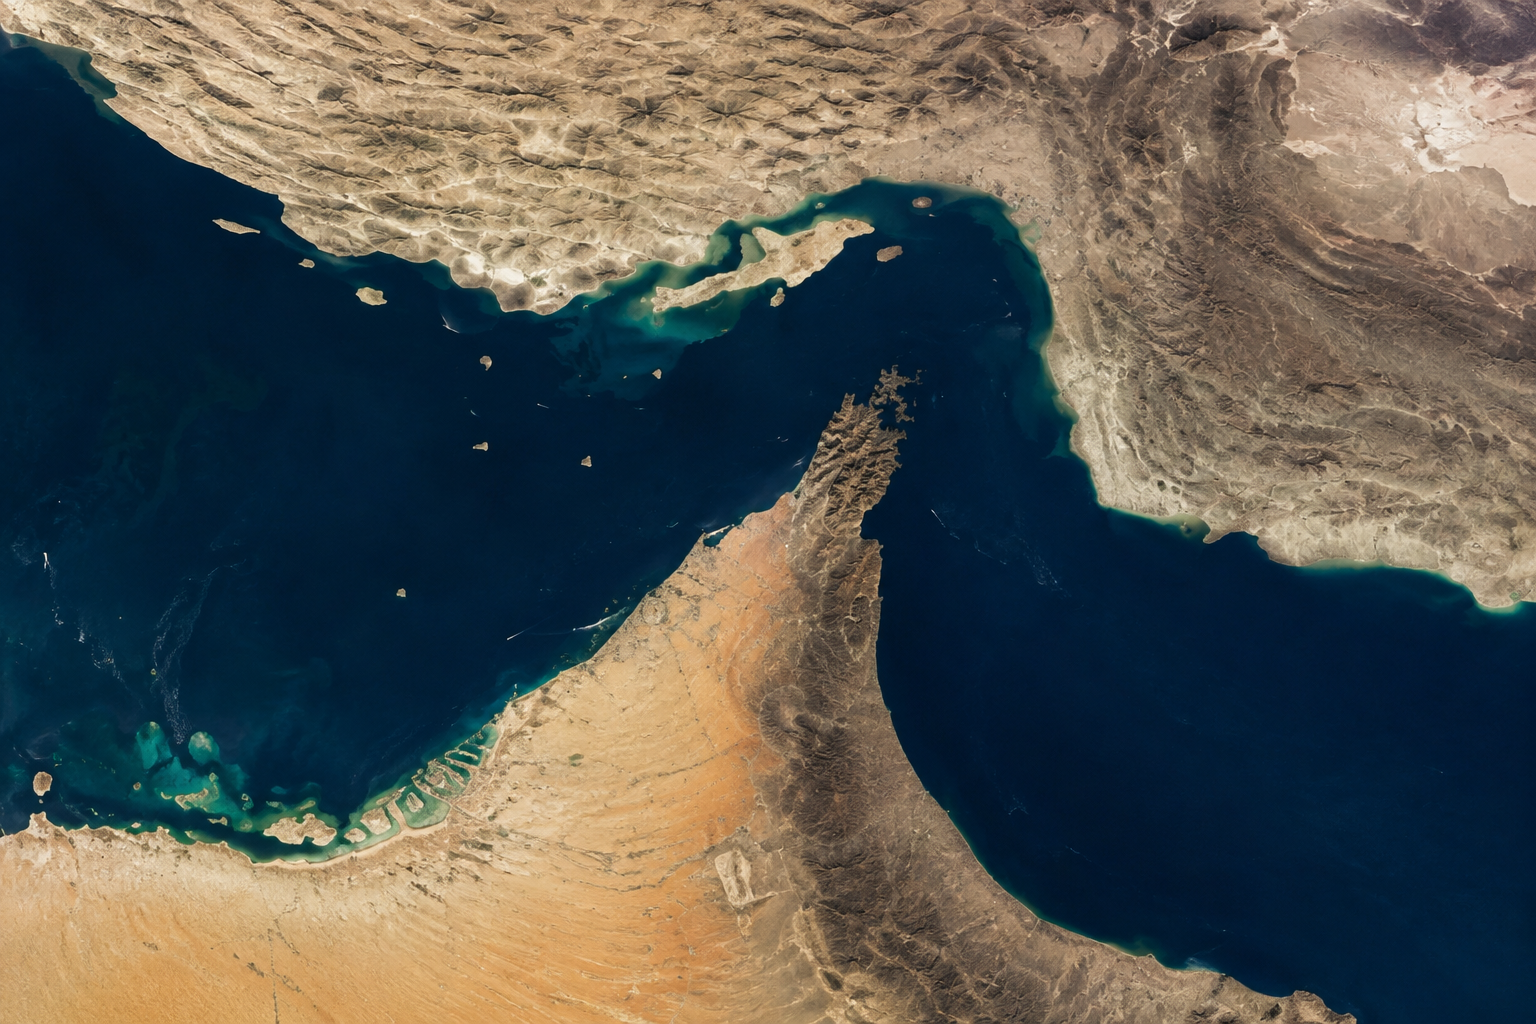
2.1 A Vulnerability Turned Reality The Strait of Hormuz has long been recognized as the world's most sensitive energy chokepoint, but the 2026 crisis turned a vulnerability that had previously existed mainly in analysts' hypothetical models into hard reality. Gulf producer output cuts at the height of the crisis exceeded 10 million barrels a day, with some estimates of regional losses reaching as high as 17 million barrels a day. 2.2 A Structural Repricing of Risk What sets this crisis apart from past episodes is its structural, longer-term effect on how geopolitical risk is priced into futures curves. Commodity strategists have noted that even once the strait fully reopens, prices are unlikely to snap back quickly to pre-war levels, because the market has been forced to reprice the concentration of oil production in the Gulf — a risk premium now embedded not just in near-term contracts but in longer-dated forward curves as well. 2.3 Diversifying the Corridor Commercially, talks between Iranian and Omani negotiators over reopening the strait's underused middle passage point to a regional push to diversify away from a single transit corridor. As of early August 2026, clearing Iranian sea mines remained a prerequisite for the full, safe return of commercial traffic. For trading houses based in Dubai and elsewhere in the Gulf, this has meant reassessing business-continuity planning and diversifying logistics routes, including greater reliance on the UAE's Habshan–Fujairah pipeline, which allows crude to bypass the strait entirely.

3. OPEC+ Policy: From Emergency Discipline to the 2027 Quota Fight

3.1 A Forced, Not Voluntary, Cut At the height of the crisis, OPEC+ production fell sharply — down 9.4 million barrels a day month-on-month to 42.4 million barrels a day — a decline driven primarily by direct disruption to Gulf producers rather than a volunt...
3. OPEC+ Policy: From Emergency Discipline to the 2027 Quota Fight
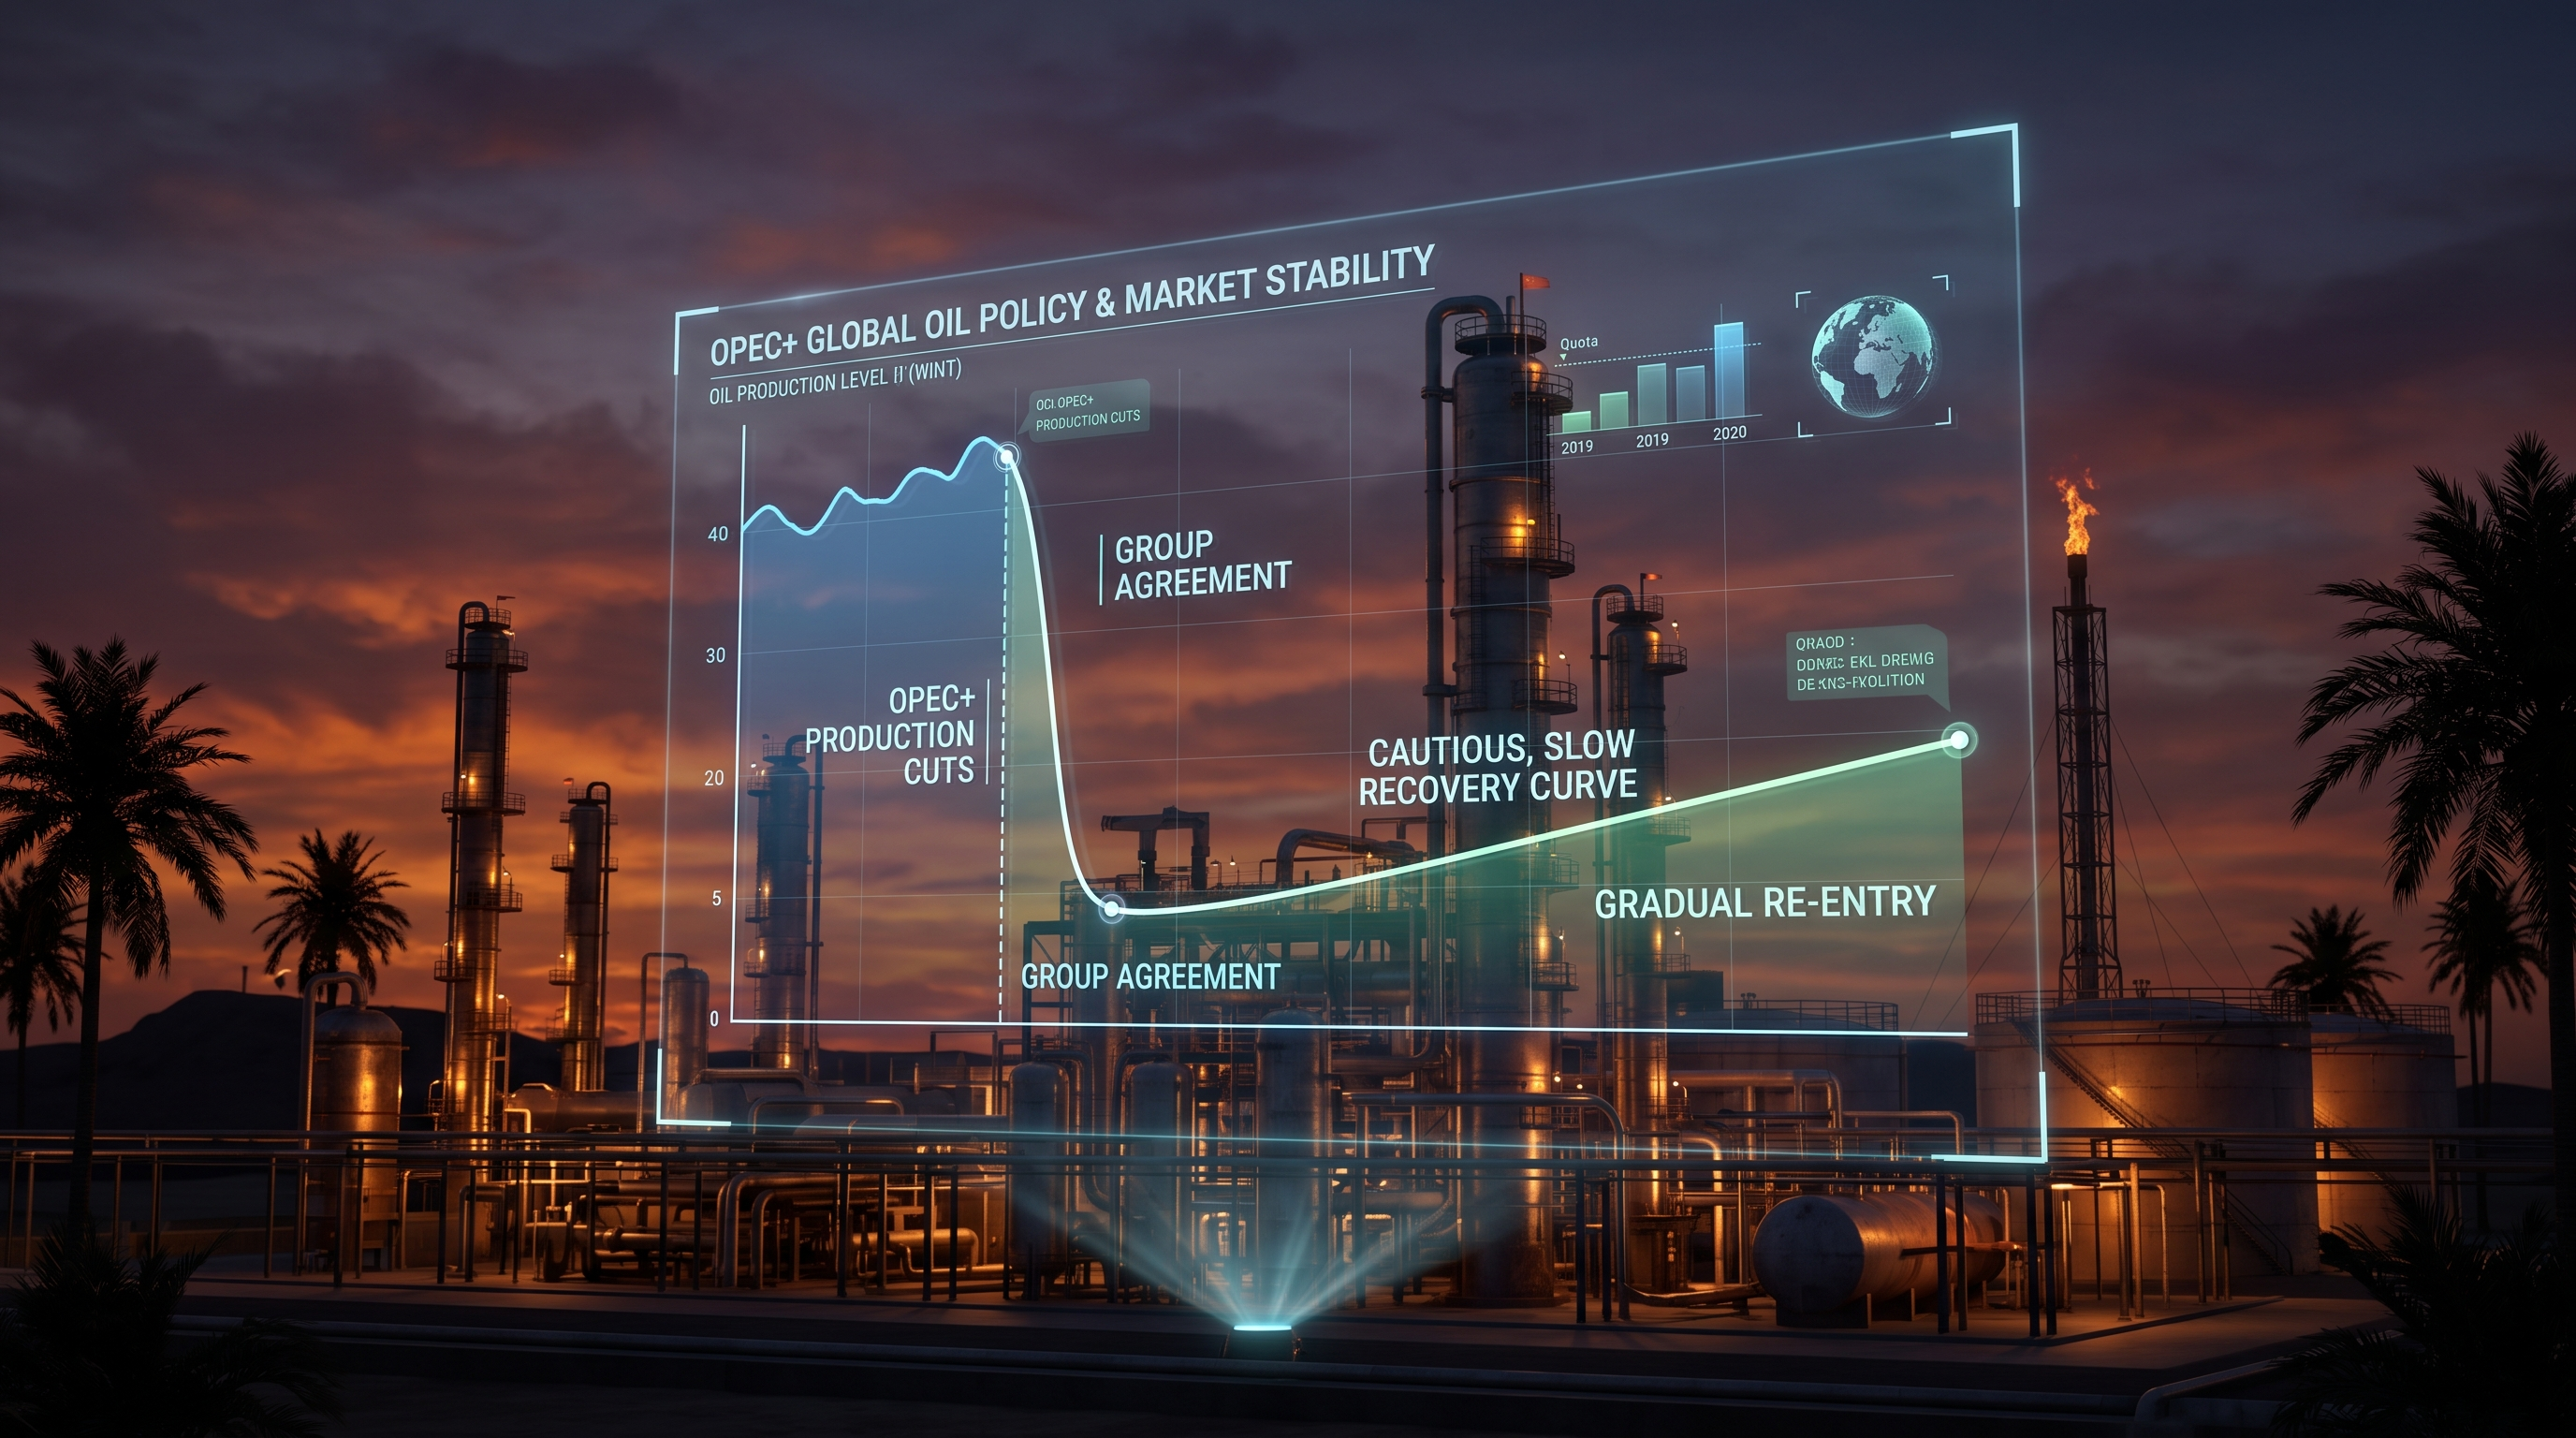
3.1 A Forced, Not Voluntary, Cut At the height of the crisis, OPEC+ production fell sharply — down 9.4 million barrels a day month-on-month to 42.4 million barrels a day — a decline driven primarily by direct disruption to Gulf producers rather than a voluntary policy choice. 3.2 A Cautious Return to Growth As tensions eased, the seven-member group began gradually restoring output, but recent market reporting indicates OPEC+ is expected to pause its gradual increases after September 2026 and hold production steady for the remainder of the year. That pause creates space for what is likely to be a more complex and sensitive negotiation over 2027 national production quotas, as members compete to recapture market share lost during the crisis. 3.3 Why the Pause Matters This cautious approach matters for two reasons. First, avoiding a rapid ramp-up of supply while global inventories are still rebuilding from the crisis-era drawdown provides relative near-term price support. Second, deferring the 2027 quota decision prolongs structural uncertainty in the medium-term supply outlook — uncertainty visible in reduced but still meaningful volatility in futures markets. Recent reporting notes that open interest in ICE Brent futures has fallen well below levels seen in calmer periods, reflecting continued trader caution around future policy swings.

4. Redrawing the Regional Benchmarks: From Dubai to the Rise of Murban

4.1 Murban's Consolidation One of the significant structural shifts the 2026 crisis accelerated was the consolidation of Murban crude as a rival benchmark for medium-sour Middle East crude. The Murban futures contract, physically delivered at the Fujairah te...
4. Redrawing the Regional Benchmarks: From Dubai to the Rise of Murban
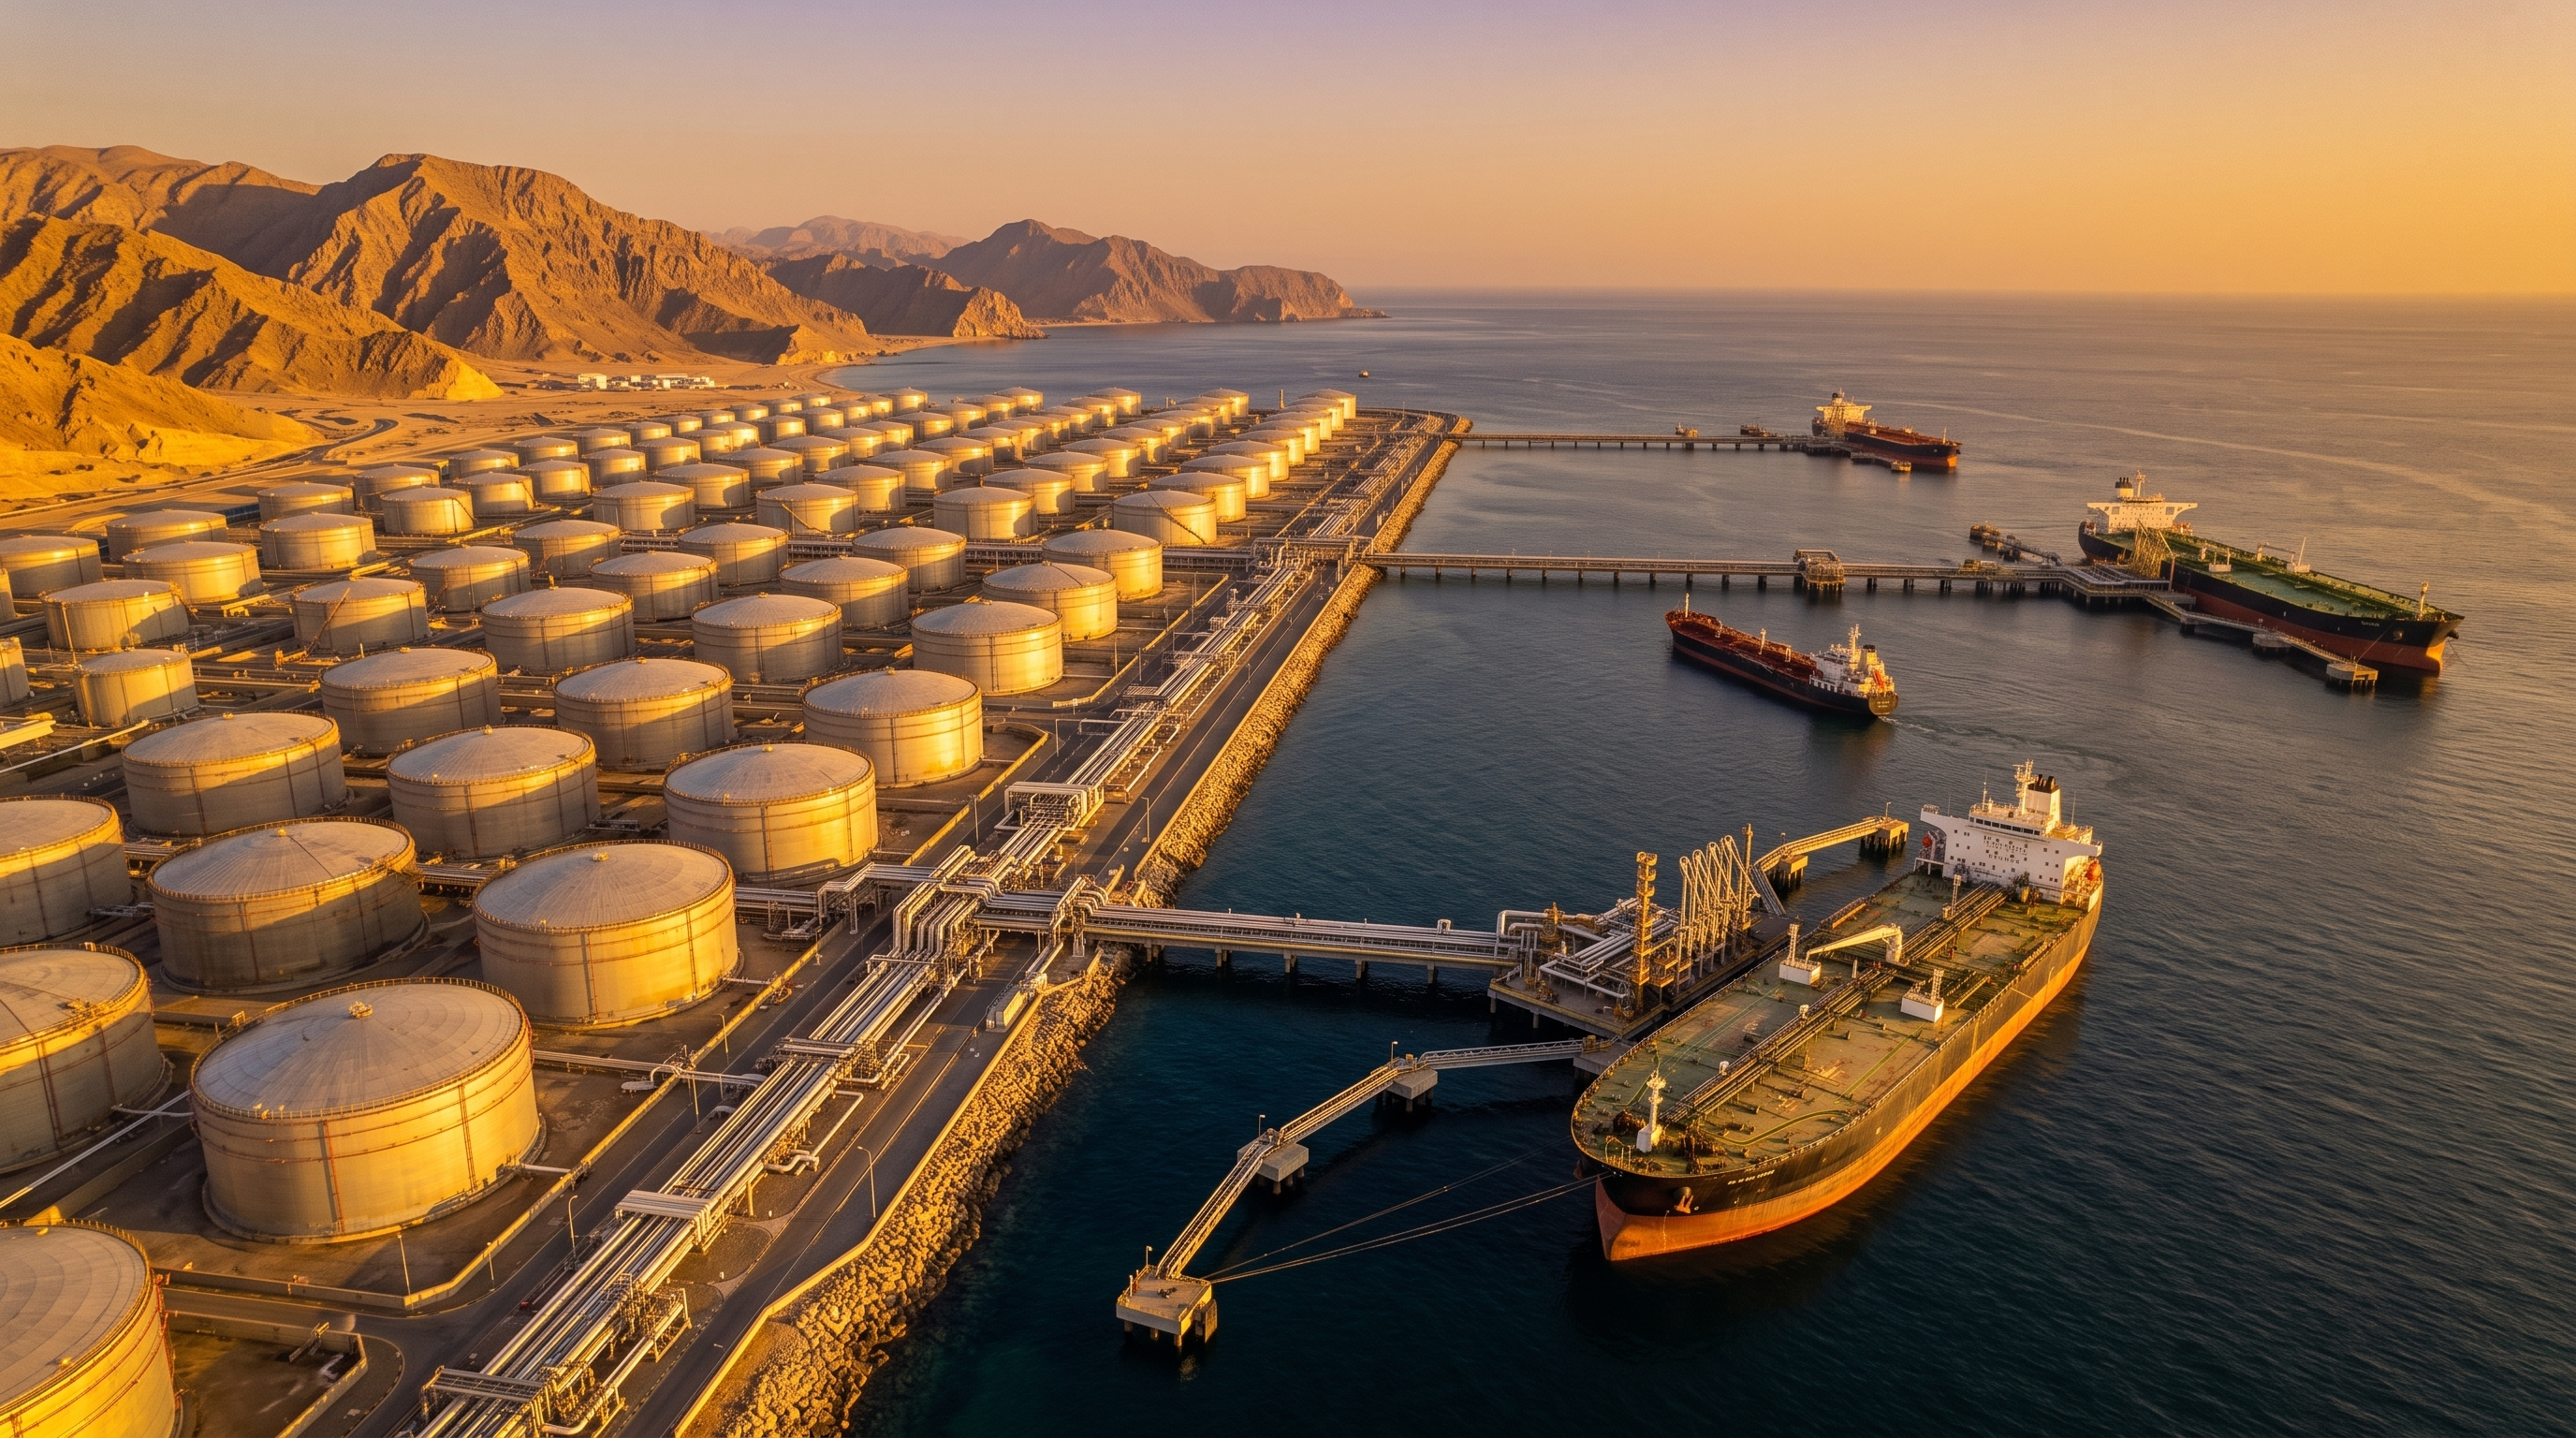
4.1 Murban's Consolidation One of the significant structural shifts the 2026 crisis accelerated was the consolidation of Murban crude as a rival benchmark for medium-sour Middle East crude. The Murban futures contract, physically delivered at the Fujairah terminal and traded on ICE Futures Abu Dhabi since 2021, has seen dramatic volume growth in recent years — total traded volumes more than doubled to over six million lots in 2024 alone. 4.2 A Clear Divergence The crisis exposed a clear divergence between Murban and other benchmarks. On some of the most volatile trading days, Murban swung by close to seven percent in a single session — behavior distinct from Brent and WTI, reflecting its direct sensitivity to Strait of Hormuz risk, since Murban cargoes load directly from the UAE's Fujairah terminal with potential transit through the strait. 4.3 An Expanding Toolkit Platts' daily Dubai Market-on-Close price discovery window, which underpins export pricing for many of the region's national oil companies, sits at the center of another structural debate: the gradual decline in traditional Dubai-grade export volumes and the rising share of destination-free cargoes that can be used interchangeably across the GME Oman contract, the IFAD Murban contract, and the Dubai MOC window. This overlap has enriched the region's derivatives ecosystem — in 2024, trading volumes for Dubai, Murban and Oman contracts all hit record highs simultaneously. For Gulf traders, this means a broader toolkit for hedging, but also a more complex fundamental picture that requires tracking multiple benchmarks rather than relying on a single reference price.

5. Derivatives and Risk Management Through the Volatility

5.1 Futures and Options Across the Complex For Gulf-based trading firms, the 2026 crisis was effectively a live stress test of risk management infrastructure. Because Murban and Dubai futures clear alongside Brent, WTI and low-sulphur gasoil on ICE, regional...
5. Derivatives and Risk Management Through the Volatility
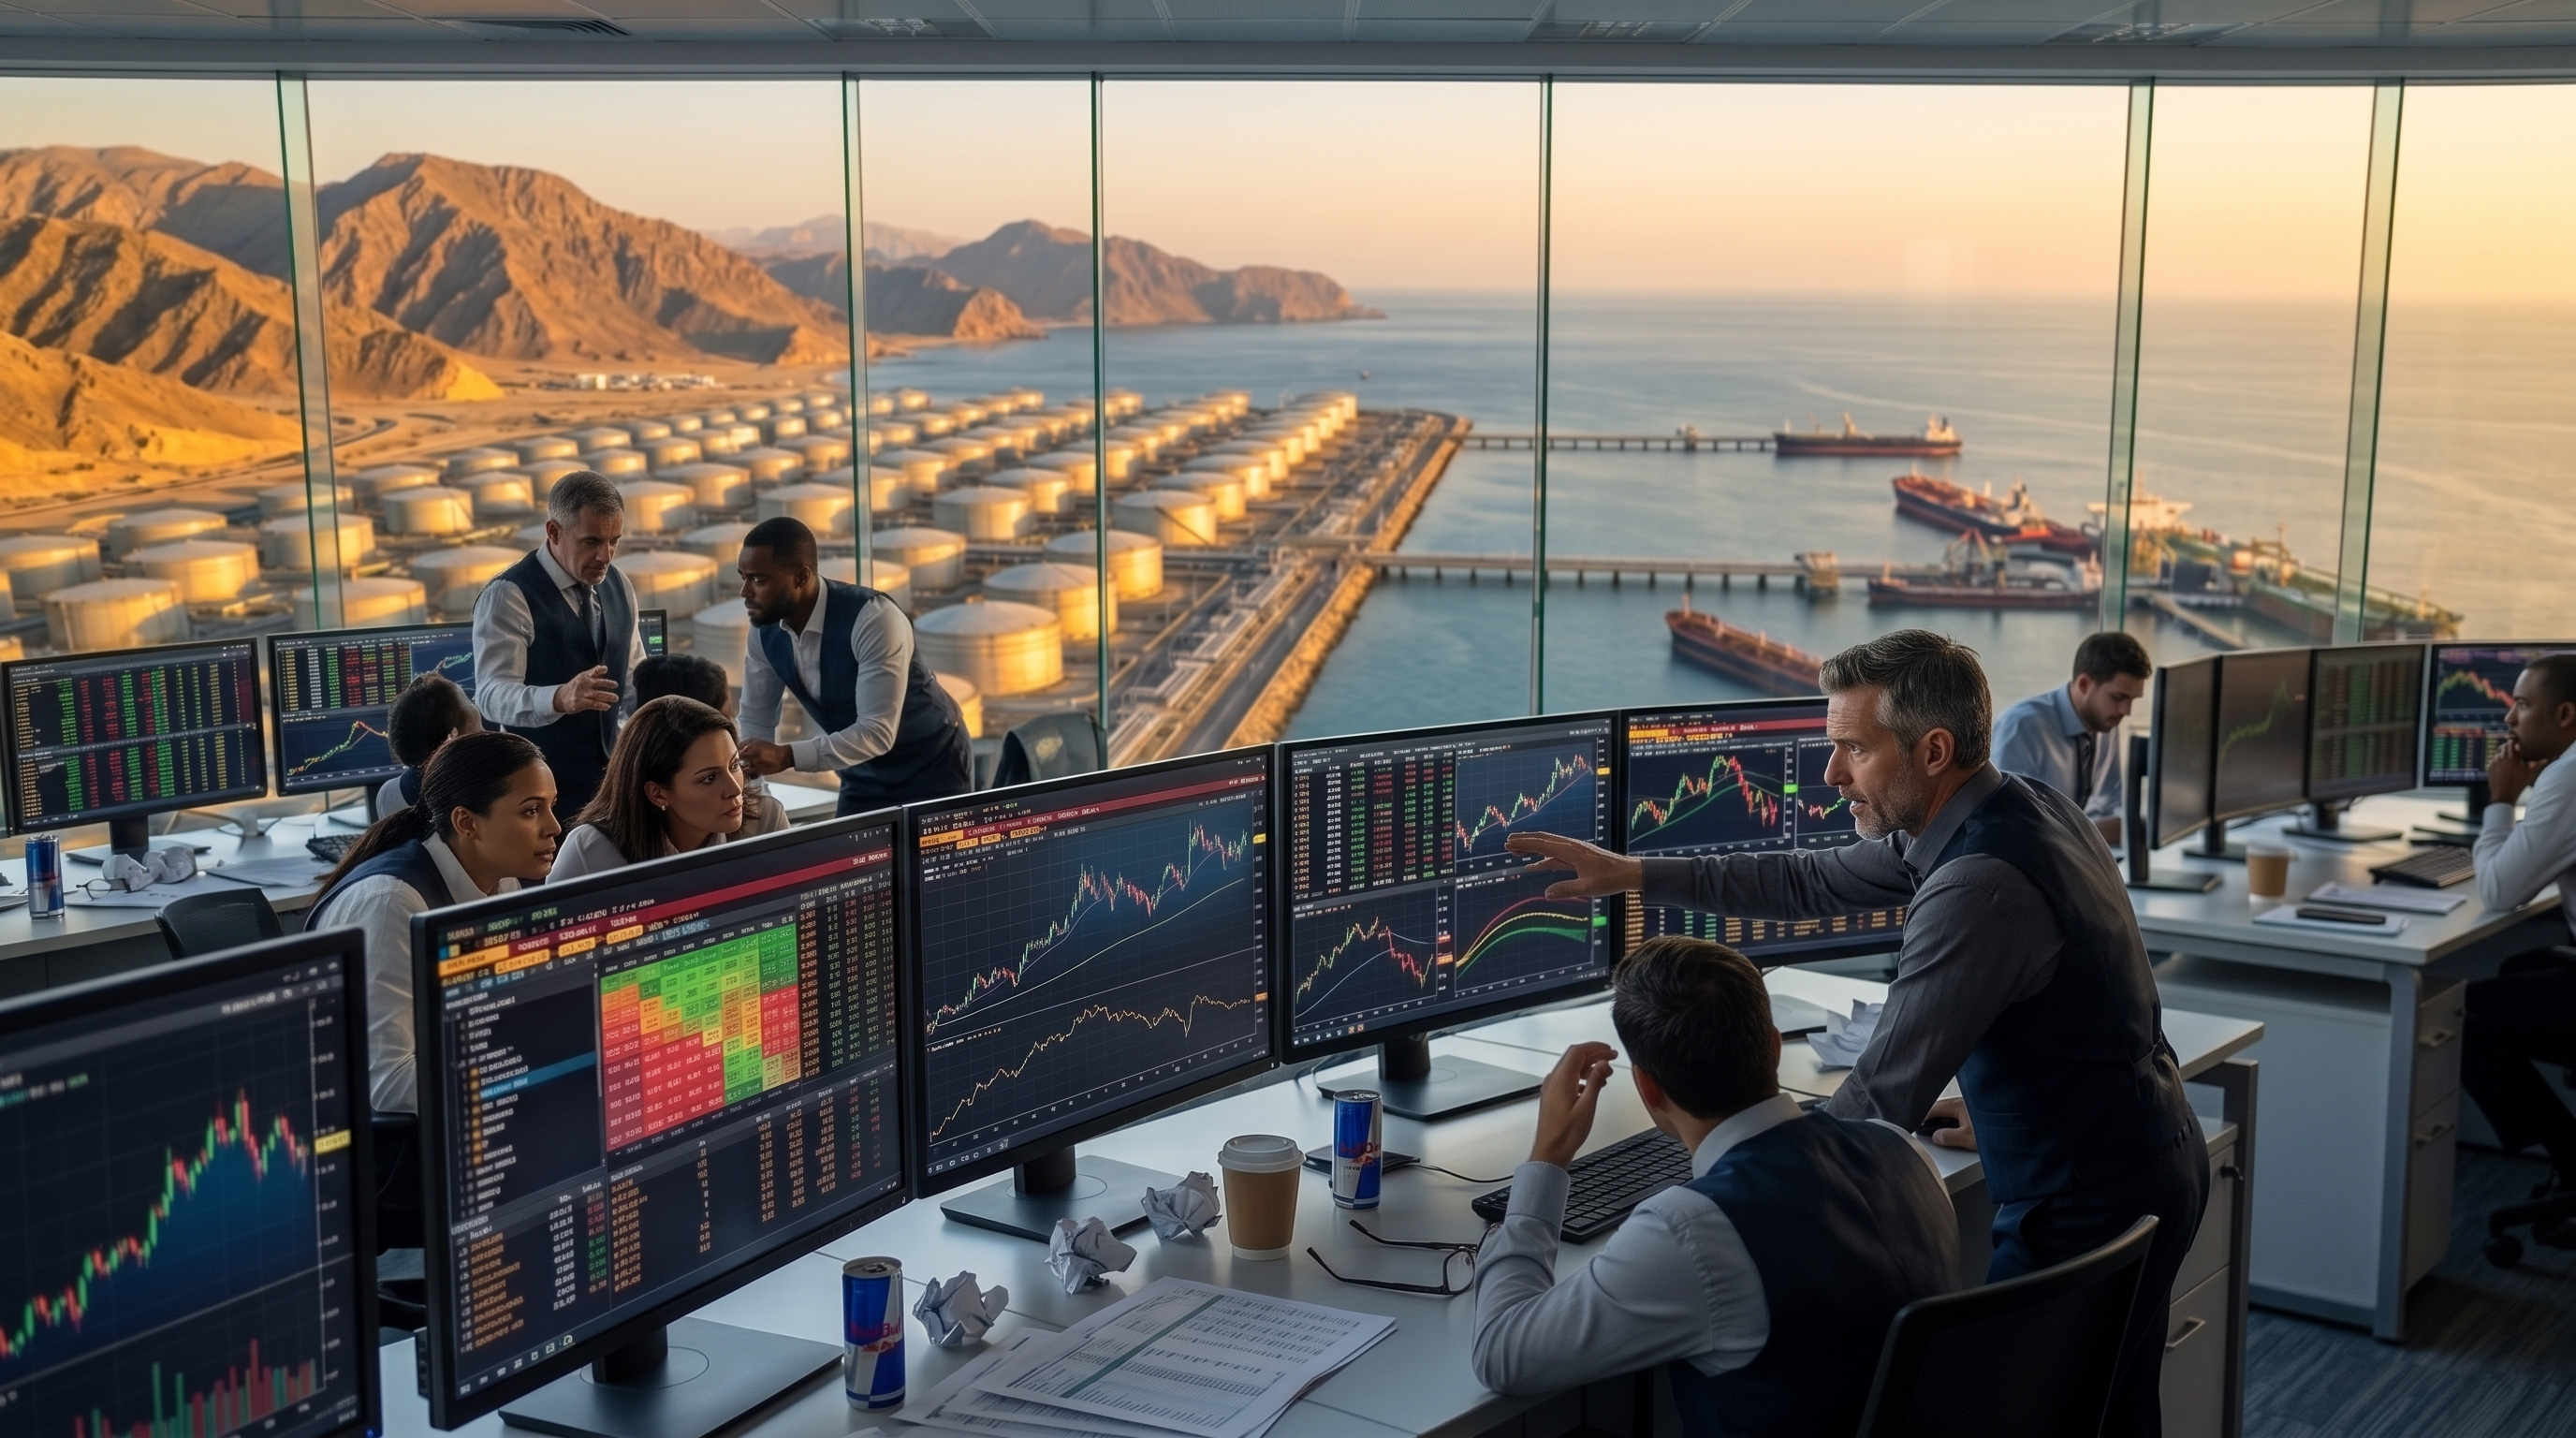
5.1 Futures and Options Across the Complex For Gulf-based trading firms, the 2026 crisis was effectively a live stress test of risk management infrastructure. Because Murban and Dubai futures clear alongside Brent, WTI and low-sulphur gasoil on ICE, regional traders were able to benefit from margin offsets across these contracts, reducing the working-capital cost of hedging. This mattered enormously during a period when daily price swings sometimes exceeded 9%. 5.2 Spread Trades and Basis Risk The sharp divergence between physical Dubai prices and paper Brent at the height of the crisis created significant arbitrage opportunities for traders closely monitoring the spread structure between the two markets. At the same time, that same divergence sharply increased basis risk for firms that had hedged physical obligations purely with Brent contracts — a reminder of how critical it is to match hedging instruments precisely to the actual physical pricing benchmark of a contract. 5.3 Gasoil and Crack Spreads With Middle East refineries — and part of the Asian refining complex dependent on Middle East feedstock — cutting runs by nearly 6 million barrels a day at the height of the crisis, middle-distillate refining margins spiked to unprecedented levels. This turned the gasoil and diesel crack spread market into one of the most actively traded segments of the products derivatives space in the first half of the year, presenting both significant supply risk and meaningful profit opportunity for firms trading 10-ppm gasoil. 5.4 The Strategic Takeaway Despite the return of relative calm, the geopolitical risk premium remains structurally embedded in long-dated futures curves. Long-term hedging strategies should now be built on the assumption that, while the probability of a similar event has fallen, it has not returned to zero.

6. Global Trade Flow Shifts: Asia, the Americas and Russia

6.1 China's Recovery The Gulf crisis temporarily but meaningfully redrew the map of global oil trade flows. China's seaborne crude imports, which fell to a 10-year low of 6.2 million barrels a day at the peak of the crisis, recovered to 7.8 million barrels a...
6. Global Trade Flow Shifts: Asia, the Americas and Russia
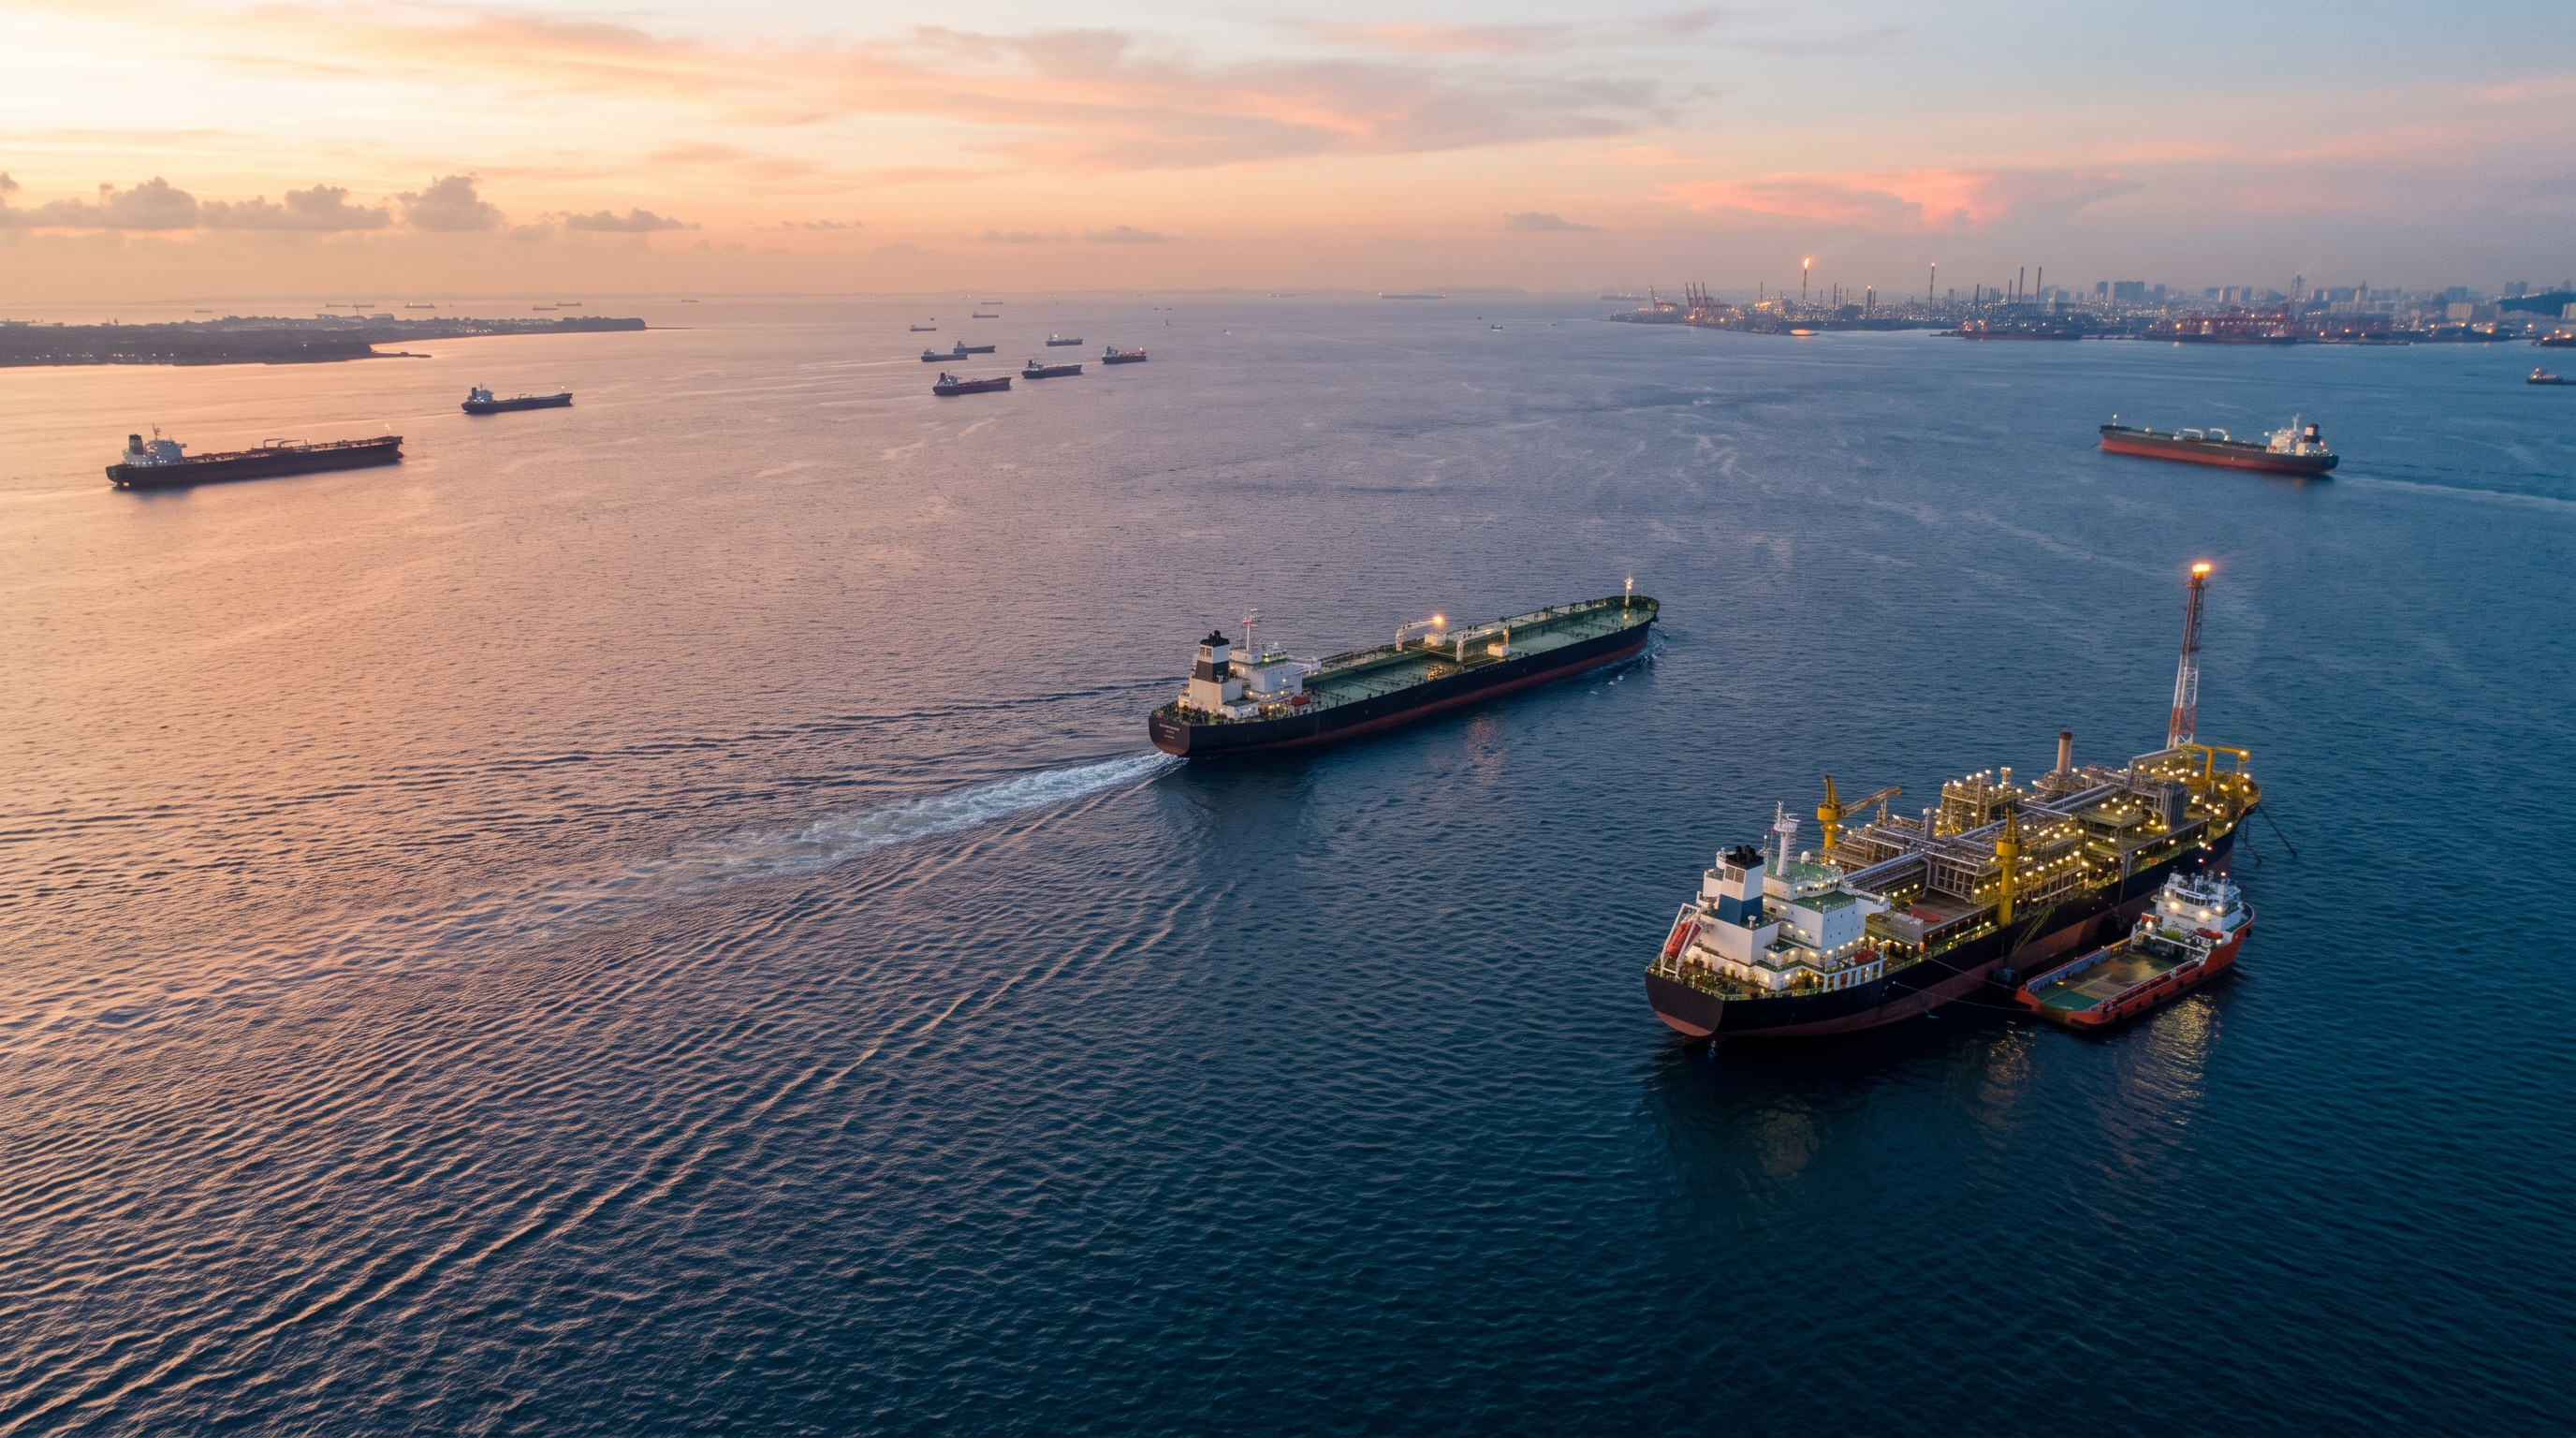
6.1 China's Recovery The Gulf crisis temporarily but meaningfully redrew the map of global oil trade flows. China's seaborne crude imports, which fell to a 10-year low of 6.2 million barrels a day at the peak of the crisis, recovered to 7.8 million barrels a day by July as stranded Gulf cargoes finally reached their destination and Russian flows climbed roughly 10% to help fill the gap. 6.2 The Americas Step In On the other side of the ledger, robust production growth across the Americas — including large-scale drawdowns from the U.S. Strategic Petroleum Reserve — combined with a surge in Atlantic Basin exports to markets east of Suez, helped offset part of the shortfall caused by the strait's closure. Since the start of the conflict, Atlantic Basin crude exports to markets east of Suez rose by around 3.5 million barrels a day. This shift demonstrated that while the Gulf remains the beating heart of global oil supply, the global logistics network has meaningful — and previously untested — capacity to adapt to short-term regional supply shocks. 6.3 The Value of Long-Standing Relationships For Gulf traders, the temporary reshuffling of flows carries a clear message: during the crisis, long-standing commercial relationships with Asian refiners — particularly in China and India — proved their strategic value, as the same customers who sought alternative sources during the shortage returned to traditional Gulf suppliers once routes reopened.

7. Products, Petrochemical Feedstocks and the Outlook Ahead

7.1 Impact on Refined Products The disruption to crude flows quickly spilled over into refined products markets. The sharp cut in Middle East refining capacity left the global low-sulphur gasoil and diesel market, particularly in Asia, notably undersupplied,...
7. Products, Petrochemical Feedstocks and the Outlook Ahead
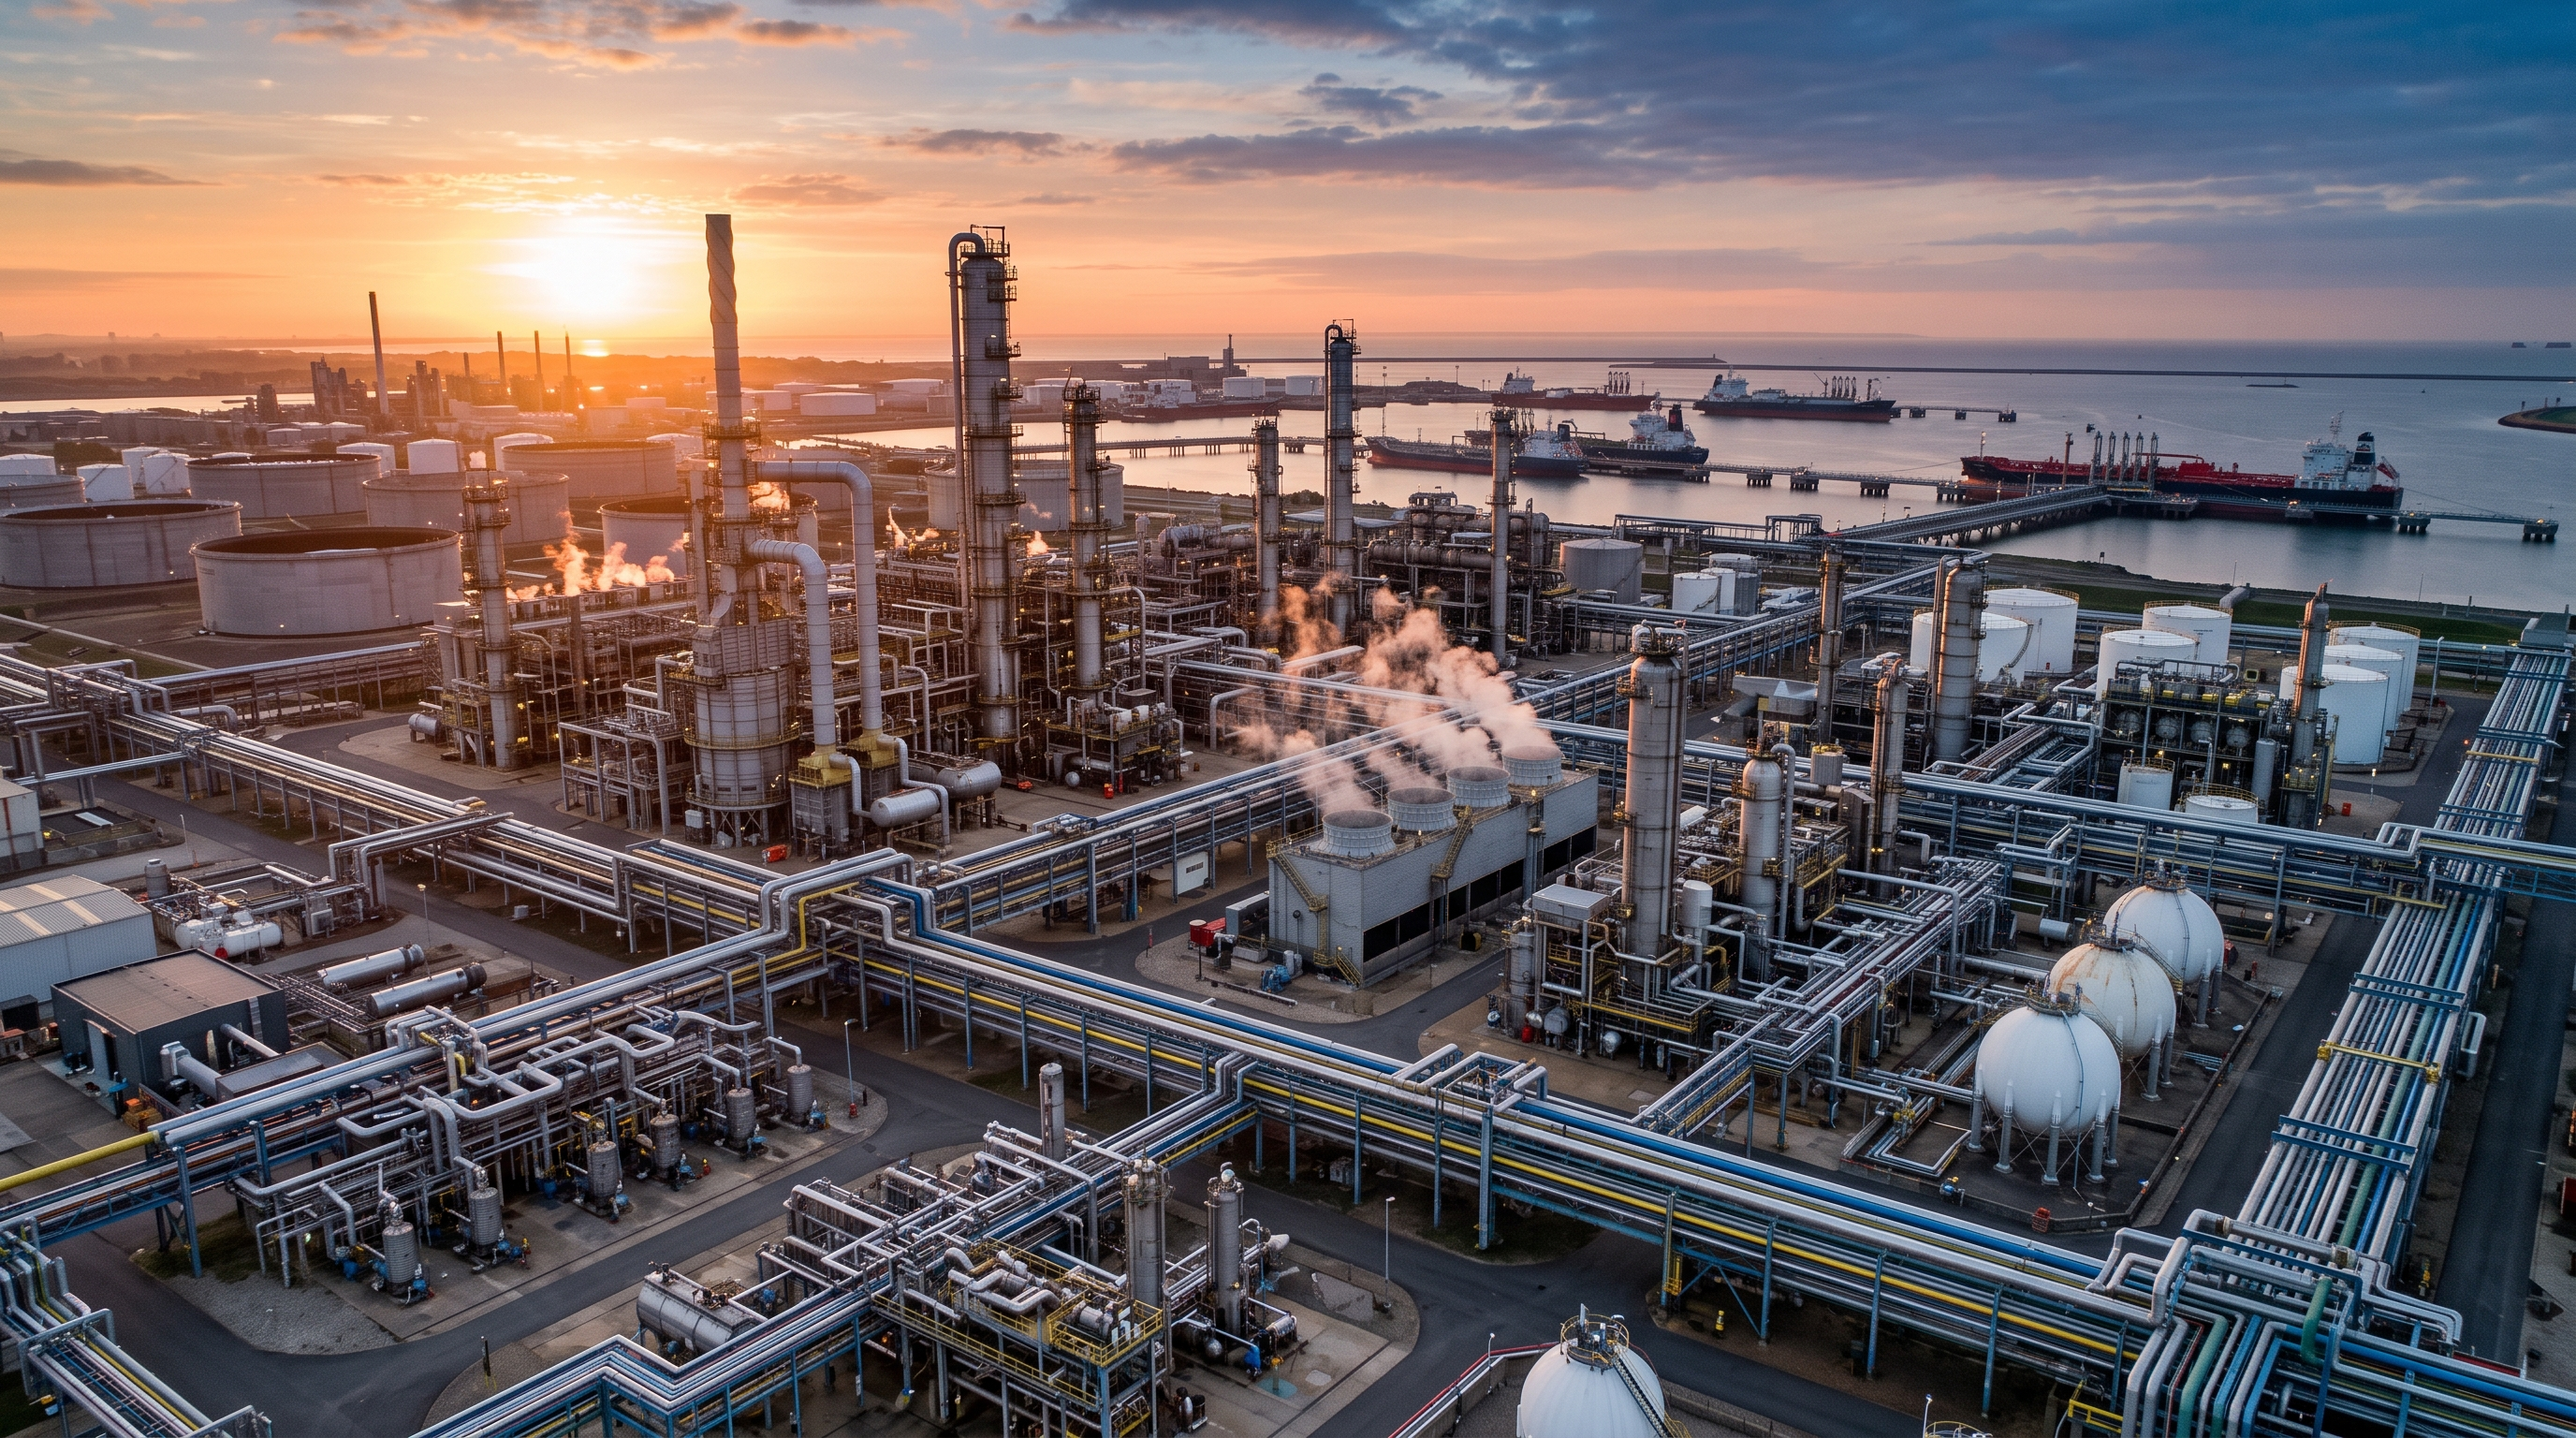
7.1 Impact on Refined Products The disruption to crude flows quickly spilled over into refined products markets. The sharp cut in Middle East refining capacity left the global low-sulphur gasoil and diesel market, particularly in Asia, notably undersupplied, and middle-distillate refining margins reached unprecedented levels at the peak of the crisis. For trading firms supplying 10-ppm diesel to Asian and African markets, the period brought both a sourcing challenge and an opportunity to build alternative supply routes via refiners in India, the U.S. Gulf Coast and Red Sea shipping lanes. 7.2 The Rise of Petrochemical Feedstock Demand On the petrochemical feedstock side, more than half of global oil supply growth in 2026 is projected to come from petrochemical feedstock products — up from roughly a third in 2025 — signaling a gradual shift in the primary driver of global oil demand growth away from transport fuels and toward industrial feedstocks. This structural trend, independent of the short-term volatility caused by the Gulf crisis, carries strategic significance for firms trading urea, granular sulphur and other petrochemical and fertilizer-related products. 7.3 Outlook Through Year-End and Into 2027 Looking toward the second half of 2026, several themes will shape the market outlook. First is the pace of the strait's full reopening, with some bank analysts projecting flows returning to around 80% of pre-crisis levels by late summer — a forecast that, based on the trajectory observed through June and July, appears broadly on track. Second, the OPEC+ decision to pause supply increases after September points to a relatively balanced market in the near term, though negotiations over 2027 quotas could themselves become a new source of volatility. Third, the EIA's latest report projects global oil consumption growth of 2.0 million barrels a day in 2027 — reaching 104.8 million barrels a day — reflecting expectations that demand will rebound after a temporary 1.2-million-barrel-a-day decline during 2026. Fourth, and perhaps most significant structurally, the residual geopolitical risk premium embedded in long-dated prices means that, even under the most stable plausible scenario, the market is unlikely to simply revert to where it stood before February 2026.

结论

Conclusion The 2026 oil crisis was more than a passing event for trading firms based in Dubai and across the Gulf — it was a structural turning point. Diversifying the benchmarks used for hedging, rather than relying solely on Brent or WTI, and making full use of the growing regional derivatives ecosystem spanning Murban and Dubai can materially improve the precision of physical risk hedging. Continuous monitoring of basis risk between physical and paper prices is essential, particularly during geopolitical tension, when this divergence can widen rapidly. Diversifying logistics routes and trading partners reduces dependence on any single corridor or geographic region, and attention to long-term structural trends — such as the growing share of petrochemical feedstock in global oil demand — will shape the future of commodity trading markets independent of short-term volatility. For firms trading energy, refined products and petrochemical feedstocks across the Gulf, 2026 was a clear reminder that in the global energy market, stability is always temporary — and readiness to manage volatility is a durable competitive advantage. Golden Falcon Energy continues to monitor global crude oil and derivatives markets to support efficient and reliable commodity trading solutions.

Need Reliable Access to Crude Oil and Products Markets?

Contact Golden Falcon Energy to receive current market pricing, product specifications and shipment availability.

立即联系我们